Mapping Seasonal Fluctuations in Player Engagement Across Global Online Poker Networks During Major Sporting Events
Avery Schwarz · Jun 25, 2026
Mapping Seasonal Fluctuations in Player Engagement Across Global Online Poker Networks During Major Sporting Events
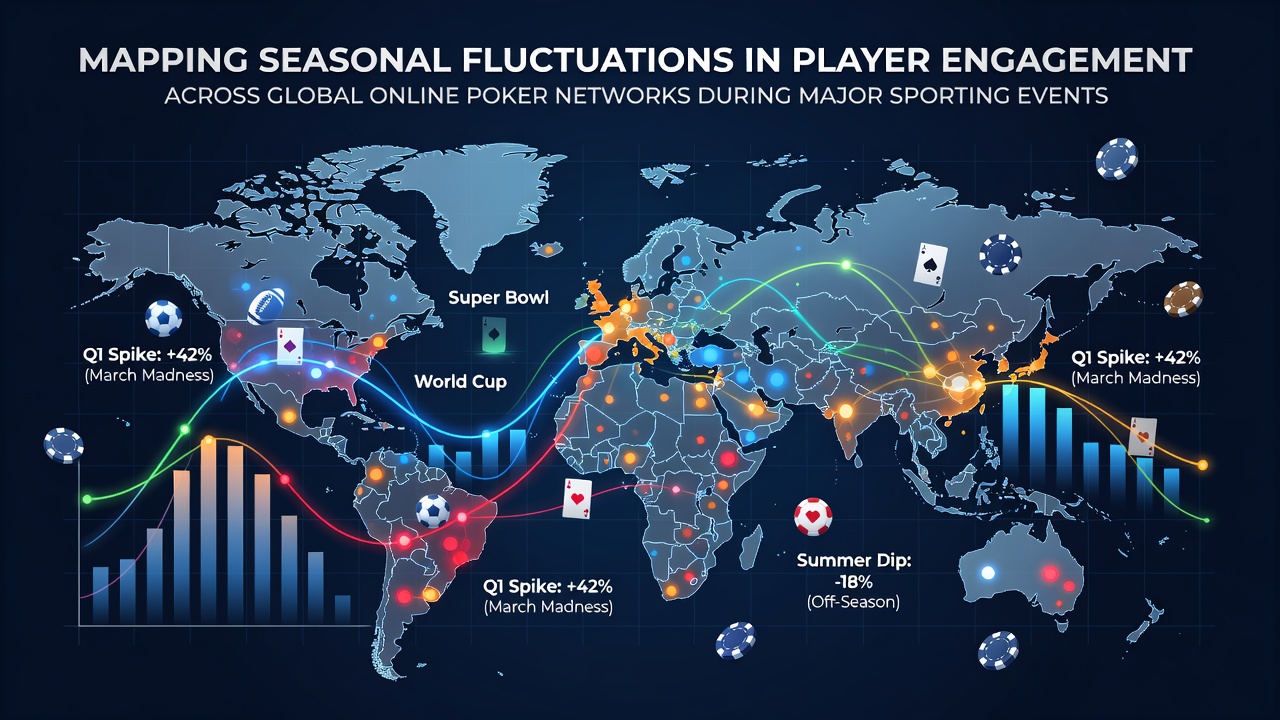
Online poker networks track player engagement through metrics such as active tables, concurrent users, and session durations, and these figures shift noticeably when major sporting events dominate global attention. Researchers compile data from platforms spanning North America, Europe, and Asia-Pacific regions to identify patterns tied to calendars like the Super Bowl, FIFA World Cup, and Olympic Games. In June 2026, as preparations intensified for the FIFA World Cup opening matches across North American venues, several networks recorded measurable dips in peak-hour tables during overlapping broadcast windows.
Data Collection Methods Across Platforms
Analysts aggregate anonymized traffic logs from multiple operators to build regional heat maps that highlight engagement changes before, during, and after marquee events. These maps incorporate timestamps synchronized with kickoff schedules, medal ceremonies, and championship games, allowing direct comparison against baseline periods from the preceding month. One study compiled by the American Gaming Association revealed that average daily active users on North American networks declined by 12 to 18 percent on Super Bowl Sunday across the prior three seasons, while European networks showed steadier retention when local leagues competed for attention.
Traffic spikes sometimes appear in the hours immediately preceding kickoff, as players complete shorter sessions before switching focus to live broadcasts. Conversely, extended lulls develop once events begin, particularly in markets where sports betting integrates directly with poker client interfaces. Cross-referencing these logs with public fixture lists produces seasonal trend lines that operators use for server allocation and promotional timing.
Regional Patterns During Overlapping Calendars
North American networks experience the sharpest engagement drops during American football playoffs and the NBA Finals, whereas European platforms register comparable reductions around UEFA Champions League finals and international rugby tournaments. Asian markets demonstrate sensitivity to cricket World Cup matches and domestic football derbies, with table counts falling 8 to 15 percent during prime-time windows according to aggregated operator reports. Observers note that simultaneous global events, such as overlapping Olympic coverage and regional horse racing festivals, compound these effects and create longer recovery periods before baseline traffic resumes.
June 2026 data illustrated this dynamic when early World Cup group-stage fixtures coincided with ongoing baseball seasons in several territories. Networks serving Canadian and Mexican players recorded staggered declines aligned with match start times rather than uniform drops, reflecting time-zone differences and varying audience priorities. Those same networks saw engagement rebound within 48 hours once matches concluded and highlight packages circulated on social channels.
Correlation With Broadcast Schedules and Betting Integration
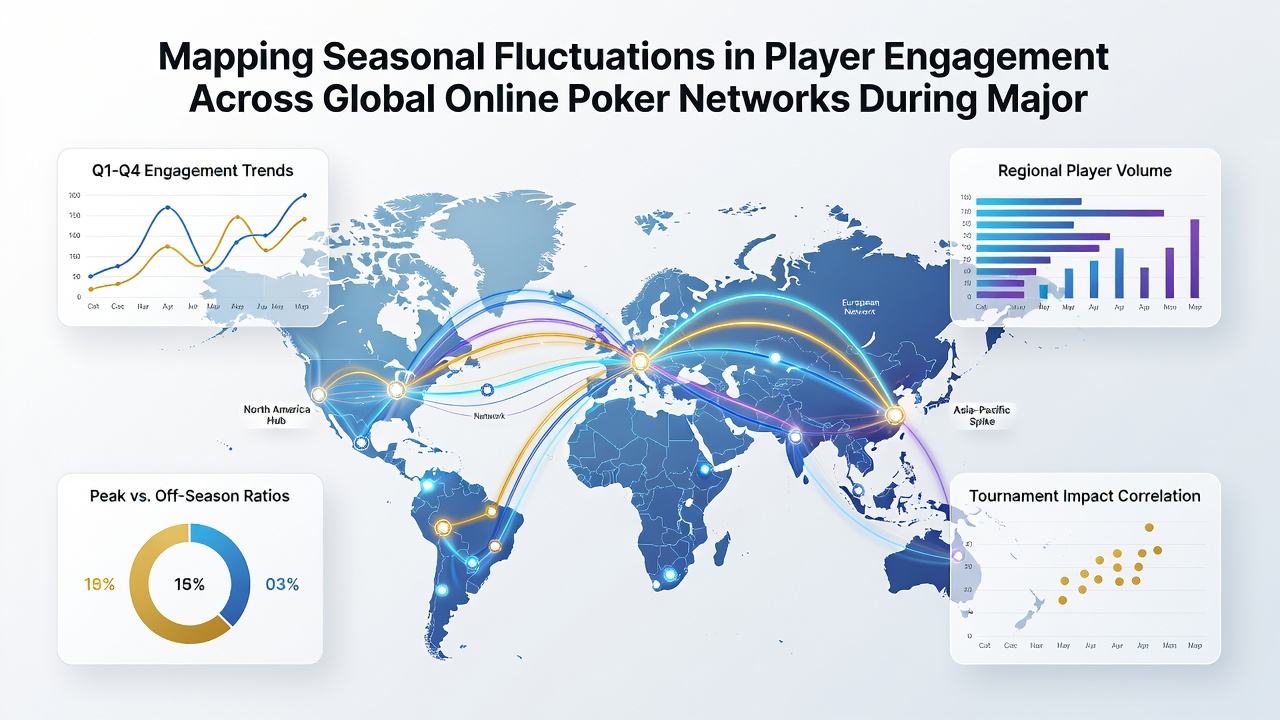
Integration between poker clients and in-app sports betting modules amplifies engagement shifts, because users often migrate between verticals within the same session. Data from the European Gaming and Betting Association indicates that operators offering unified wallets experience faster table attrition once live odds become available for concurrent events. Conversely, networks without integrated betting maintain flatter curves, though absolute volumes remain lower overall.
Pre-event promotional campaigns, such as freerolls tied to tournament brackets or deposit bonuses activated by specific match outcomes, partially offset declines. These incentives attract short-term traffic spikes in the 24 hours leading into kickoff, yet they rarely sustain through the event duration itself. Post-event analysis shows that loyalty program activity increases once viewers return to poker tables seeking extended sessions after sports viewing fatigue sets in.
Longer-Term Seasonal Modeling
Operators apply multi-year datasets to forecast engagement curves for upcoming calendars, adjusting marketing spend and tournament scheduling accordingly. Models factor in variables including daylight saving transitions, national holiday overlaps, and recurring league schedules that create predictable troughs. For instance, late-spring periods in the northern hemisphere frequently coincide with both European football title deciders and North American playoff runs, producing compounded volume reductions across transatlantic networks.
June 2026 projections incorporated these overlapping variables when planners aligned satellite tournaments with World Cup rest days to recapture displaced traffic. Similar modeling helped platforms serving Australasian users prepare for winter rugby seasons that historically suppress evening table counts. Continuous refinement of these models relies on real-time API feeds that update engagement dashboards within minutes of schedule changes or weather disruptions affecting outdoor events.
Conclusion
Mapping seasonal fluctuations supplies operators with actionable intelligence for resource management and promotional design across interconnected poker ecosystems. Patterns tied to major sporting events recur with sufficient consistency to support predictive planning, while regional differences underscore the value of localized calibration. Continued refinement of cross-platform data aggregation will sharpen these maps as more jurisdictions authorize regulated online play and additional sporting calendars integrate with digital card rooms.